
This environmental compliance report consolidates the greenhouse gas and wastewater monitoring records published by Nghia Son for the 2023 and 2024 reporting years. It covers both production sites in Dong Nai province and replaces the six separate annual filings that were previously published as individual posts, so that buyers, auditors and certification bodies can review the full monitoring history in one place.
Environmental Compliance Report Scope and Methodology
Each environmental compliance report on this page follows the same accounting boundary. Emissions are grouped into two categories defined by the GHG Protocol:
- Scope 1 – direct emissions. Fuel and material burned or released on site: DO (diesel) oil used by generators and forklifts, wood waste consumed in the boiler, biomass rice husk, and refrigerant losses from air conditioning units.
- Scope 2 – indirect energy emissions. Purchased electricity drawn from the national grid, converted to tonnes of CO2 using the published national grid emission factor.
Activity data is taken from metered consumption records and purchase invoices for the calendar year, then multiplied by the applicable emission factor for each source. Wastewater figures come from samples collected on site and analysed by an accredited third-party laboratory; the signed laboratory certificates are reproduced in full further down this page.
Two facilities are covered throughout:
- Factory 1 – the Dong Nai branch plant operated under Nghia Son Furniture Company Limited.
- Factory 2 – the plant operated under Nghia Son Wood Products Manufacturing and Trading Co., Ltd.
Note on data: the 2024 electricity figure for Factory 1 appears in the original filing as “945,057 Mwh”. It is published here as 945.057 MWh, the reading consistent with the 639.43 tonnes of CO2 reported alongside it and with the 0.6766 tCO2/MWh grid factor applied across all four tables on this page.
CO2 Emissions Report 2024
Factory 1 – Nghia Son Furniture Co., Ltd (Dong Nai Branch)
| No. | Emission source | Activity data | Unit | Tonnes of CO2 | Scope |
|---|---|---|---|---|---|
| 1 | DO oil | 20 | liter | 0.05 | Scope 1 |
| 2 | National grid (electricity) | 945.057 | Mwh | 639.43 | Scope 2 |
| 3 | Wood waste | 941,020.00 | kg | 1,495.88 | Scope 1 |
| 4 | Air conditioner | 0 | kg | 0.7970265 | Scope 1 |
| Total Scope 1 | 1,496.73 | ||||
| Total Scope 2 | 639.43 | ||||
| Total | 2,136.16 | ||||
Factory 2 – Nghia Son Wood Products Mfg & Trading Co., Ltd
| No. | Emission source | Activity data | Unit | Tonnes of CO2 | Scope |
|---|---|---|---|---|---|
| 1 | DO oil | 20 | liter | 0.05 | Scope 1 |
| 2 | National grid (electricity) | 2,030.93 | Mwh | 1,374.12 | Scope 2 |
| 3 | Wood waste | 305,832.00 | kg | 486.1628 | Scope 1 |
| 4 | Air conditioner | 0 | kg | 0.7530219 | Scope 1 |
| Total Scope 1 | 486.97 | ||||
| Total Scope 2 | 1,374.12 | ||||
| Total | 1,861.09 | ||||
CO2 Emissions Report 2023
Factory 1 – Nghia Son Furniture Co., Ltd (Dong Nai Branch)
| No. | Emission source | Activity data | Unit | Tonnes of CO2 | Scope |
|---|---|---|---|---|---|
| 1 | DO oil | 20 | liter | 0.05 | Scope 1 |
| 2 | National grid (electricity) | 1,252.06 | Mwh | 847.15 | Scope 2 |
| 3 | Wood waste | 941,020.00 | kg | 1,495.88 | Scope 1 |
| 4 | Air conditioner | 42.95 | kg | 0.8777205 | Scope 1 |
| Total Scope 1 | 1,496.82 | ||||
| Total Scope 2 | 847.15 | ||||
| Total | 2,343.96 | ||||
Factory 2 – Nghia Son Wood Products Mfg & Trading Co., Ltd
| No. | Emission source | Activity data | Unit | Tonnes of CO2 | Scope |
|---|---|---|---|---|---|
| 1 | DO oil | 20 | liter | 0.05 | Scope 1 |
| 2 | Electricity | 1,679.20 | Mwh | 1,136.15 | Scope 2 |
| 3 | Wood waste | 216,658.00 | kg | 344.4082 | Scope 1 |
| 4 | Biomass rice husk waste | 4,470.00 | kg | 7.1057 | Scope 1 |
| 5 | Air conditioner | 36.68 | kg | 0.7121844 | Scope 1 |
| Total Scope 1 | 352.28 | ||||
| Total Scope 2 | 1,136.15 | ||||
| Total | 1,488.43 | ||||
Related reading
Year-on-Year Comparison, 2023 to 2024
Reading the two years of this environmental compliance report side by side shows that the group total moved very little, while the split between the two factories shifted significantly.
| Facility | 2023 (tonnes CO2) | 2024 (tonnes CO2) | Change |
|---|---|---|---|
| Factory 1 – Dong Nai Branch | 2,343.96 | 2,136.16 | -207.80 (-8.9%) |
| Factory 2 | 1,488.43 | 1,861.09 | +372.66 (+25.0%) |
| Combined | 3,832.39 | 3,997.25 | +164.86 (+4.3%) |
Factory 1 reduced its footprint by 207.80 tonnes, driven almost entirely by lower grid consumption, which fell from 1,252.06 to 945.057 MWh. Factory 2 moved in the opposite direction: grid electricity rose from 1,679.20 to 2,030.93 MWh, adding 237.97 tonnes to Scope 2, while wood waste burned in the boiler increased from 216,658 kg to 305,832 kg. Rice husk biomass, recorded at Factory 2 in 2023, does not appear in its 2024 filing.
The combined increase of 4.3 percent tracks the rise in production volume across both sites over the same period. Because Scope 2 now accounts for slightly more than half of the group total, grid electricity remains the single largest lever for reducing emissions in future reporting years.
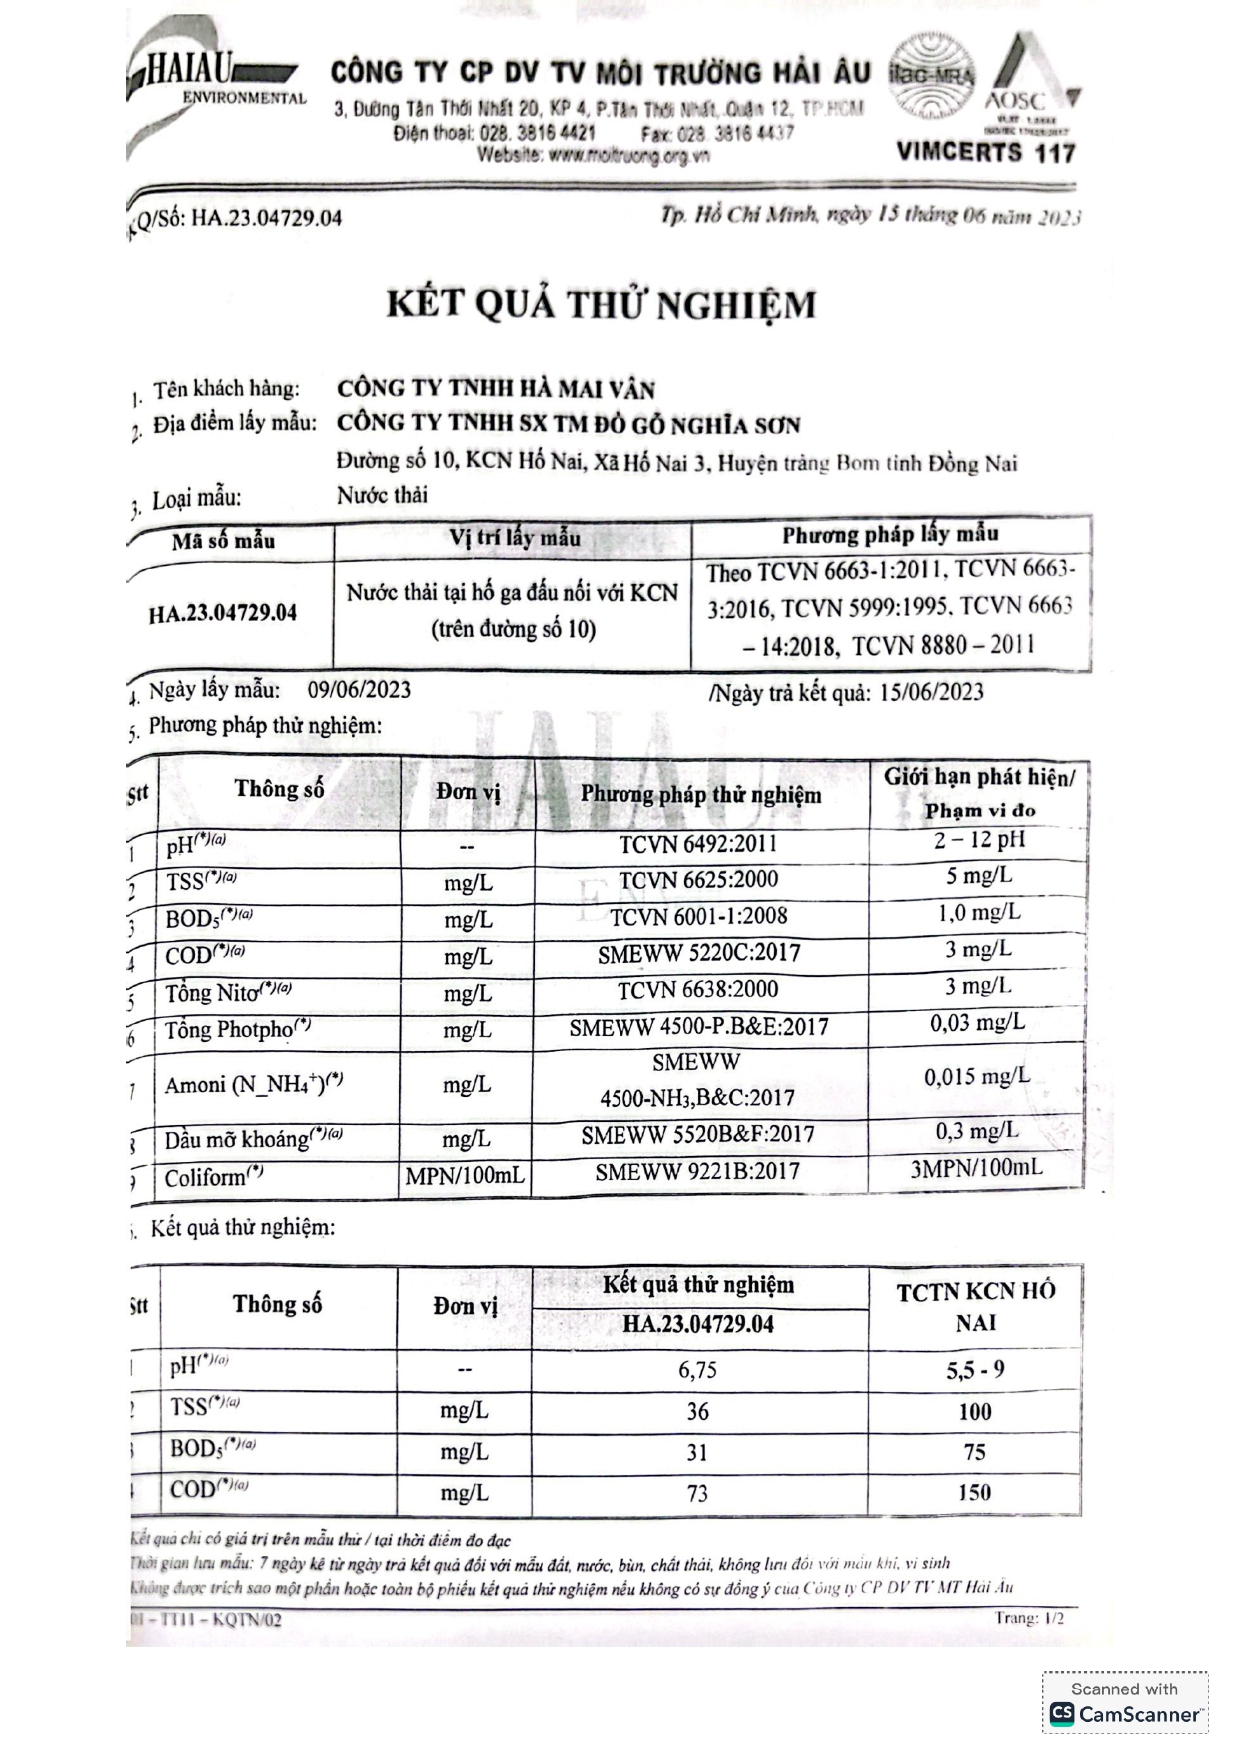
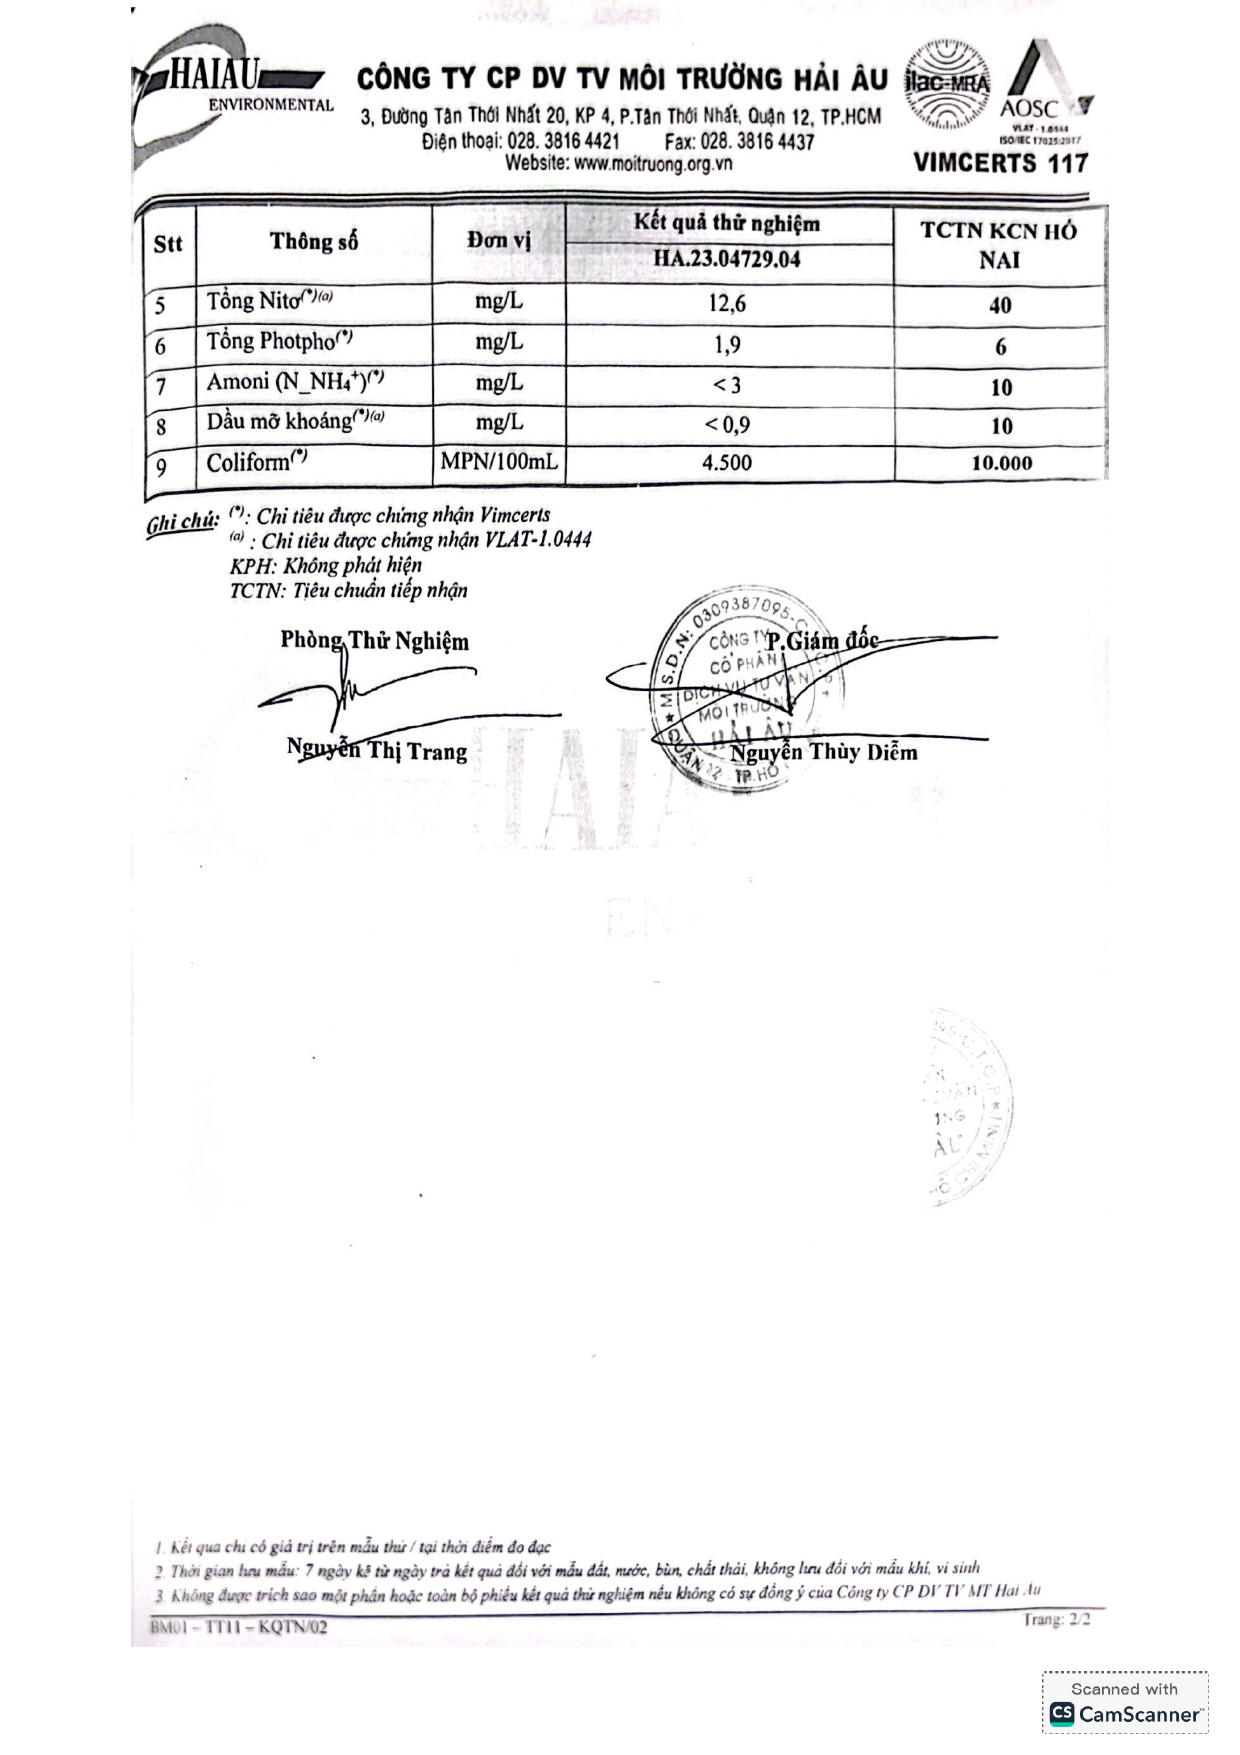
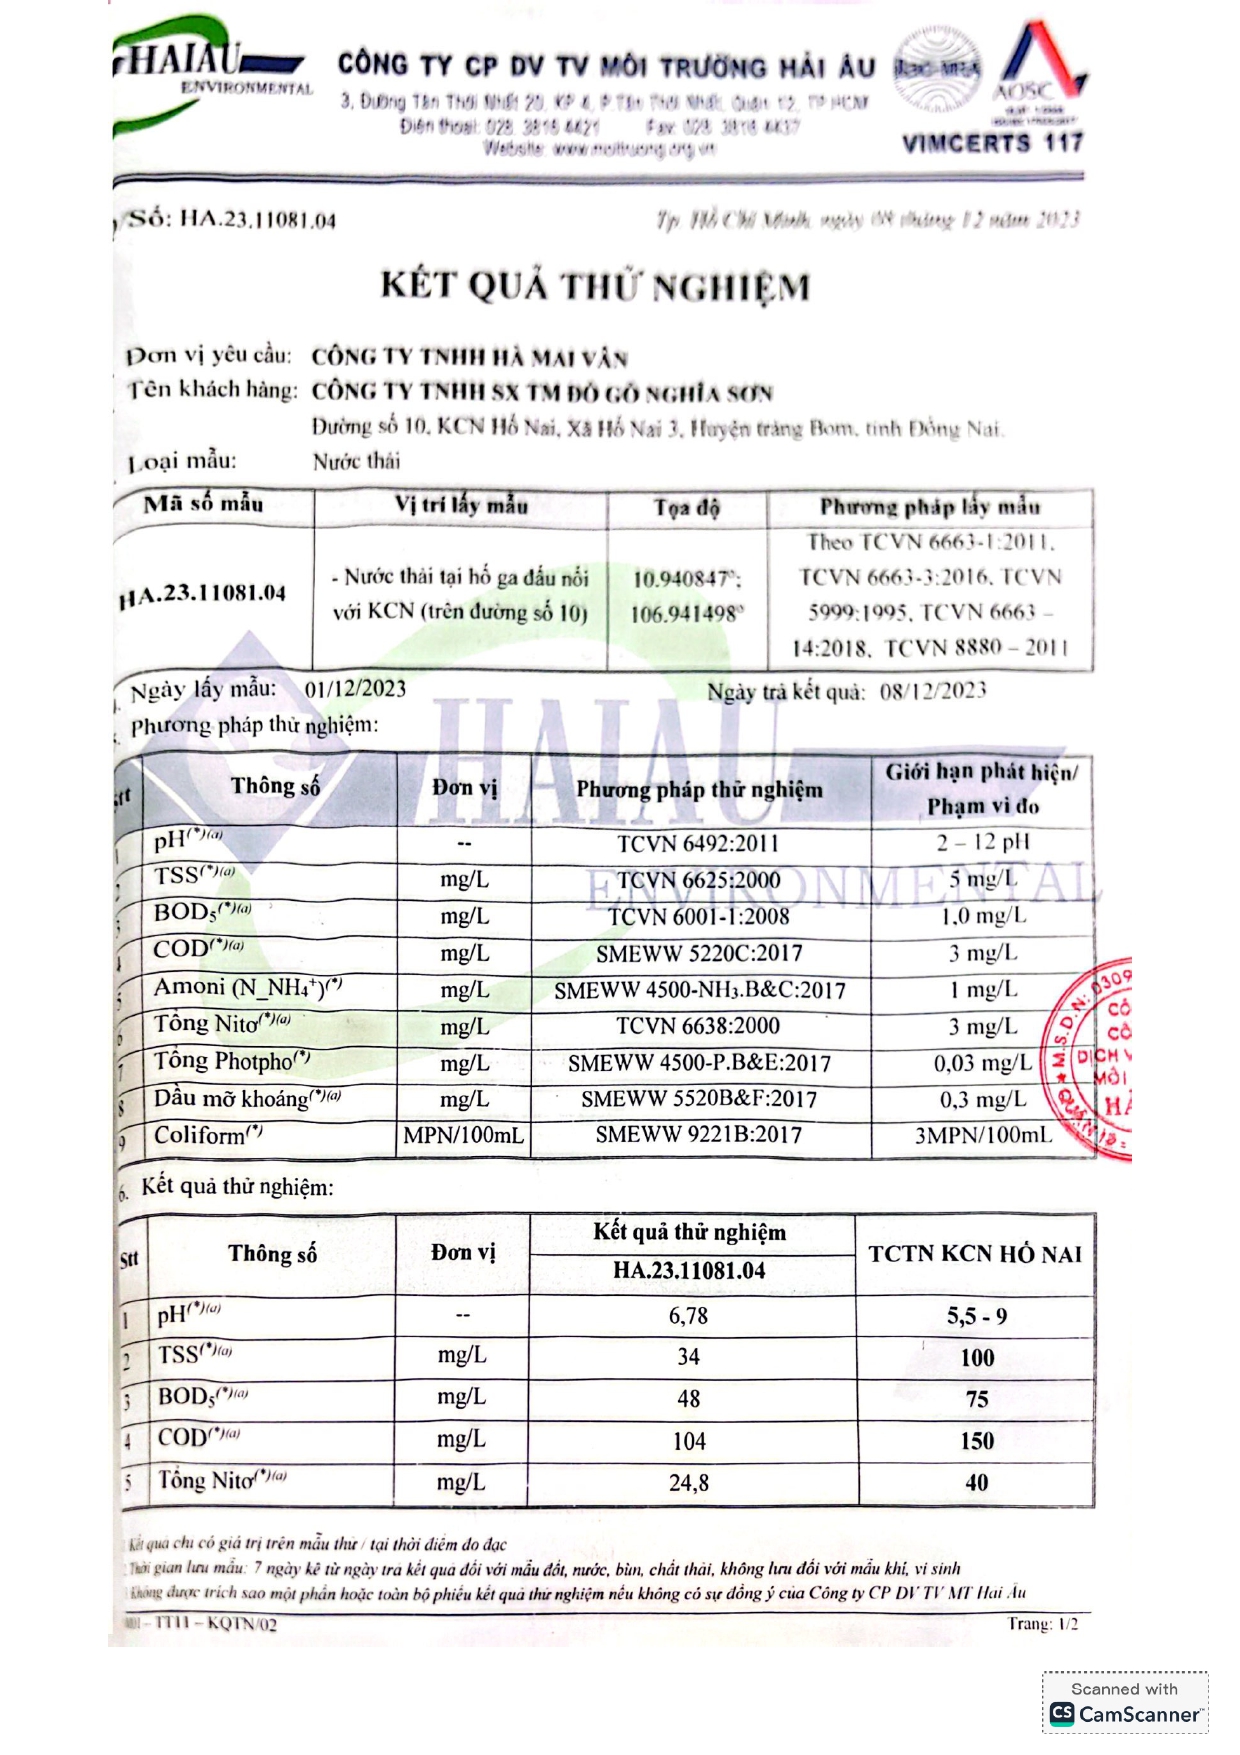
Wastewater Measurement Results 2023 – Dong Nai Factory
Wastewater at the Dong Nai site is sampled and analysed annually by an accredited external laboratory. The 2023 certificates were filed under two entities, reproduced below in the order and wording of the original filings. They form the wastewater part of the environmental compliance report for 2023 and appear without alteration, including the analysed parameters, measured values and the permitted limits they are compared against.
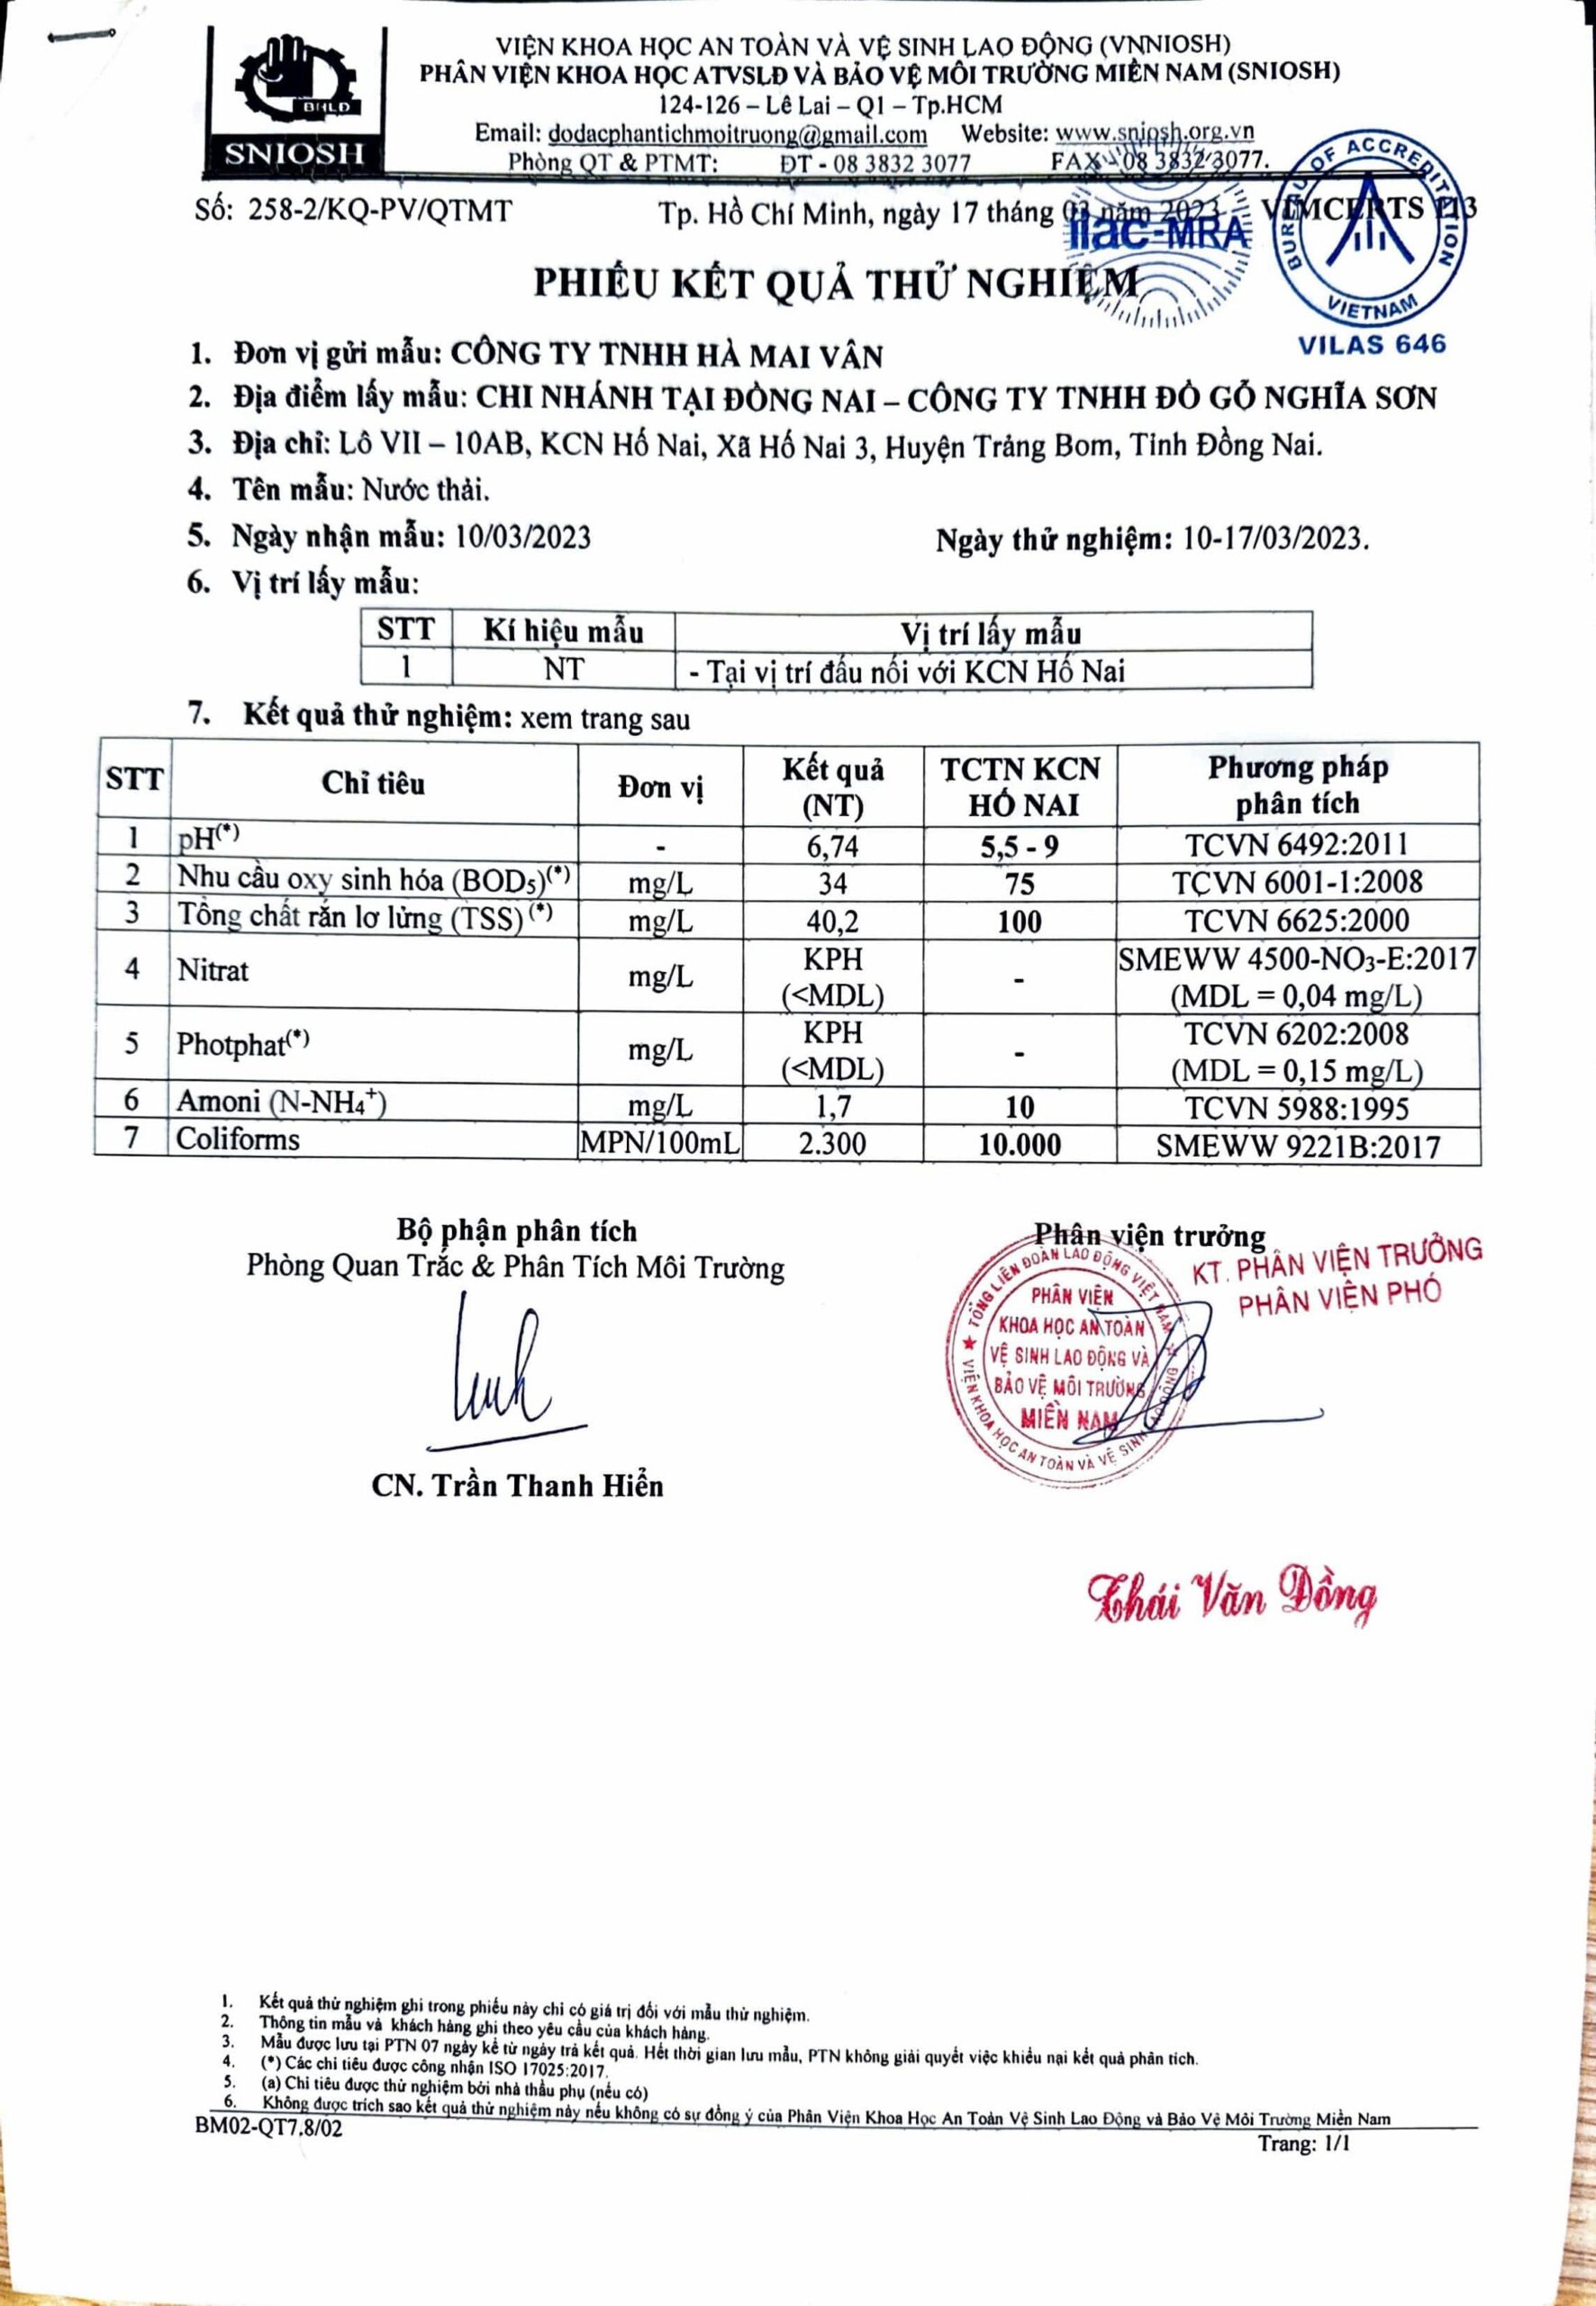
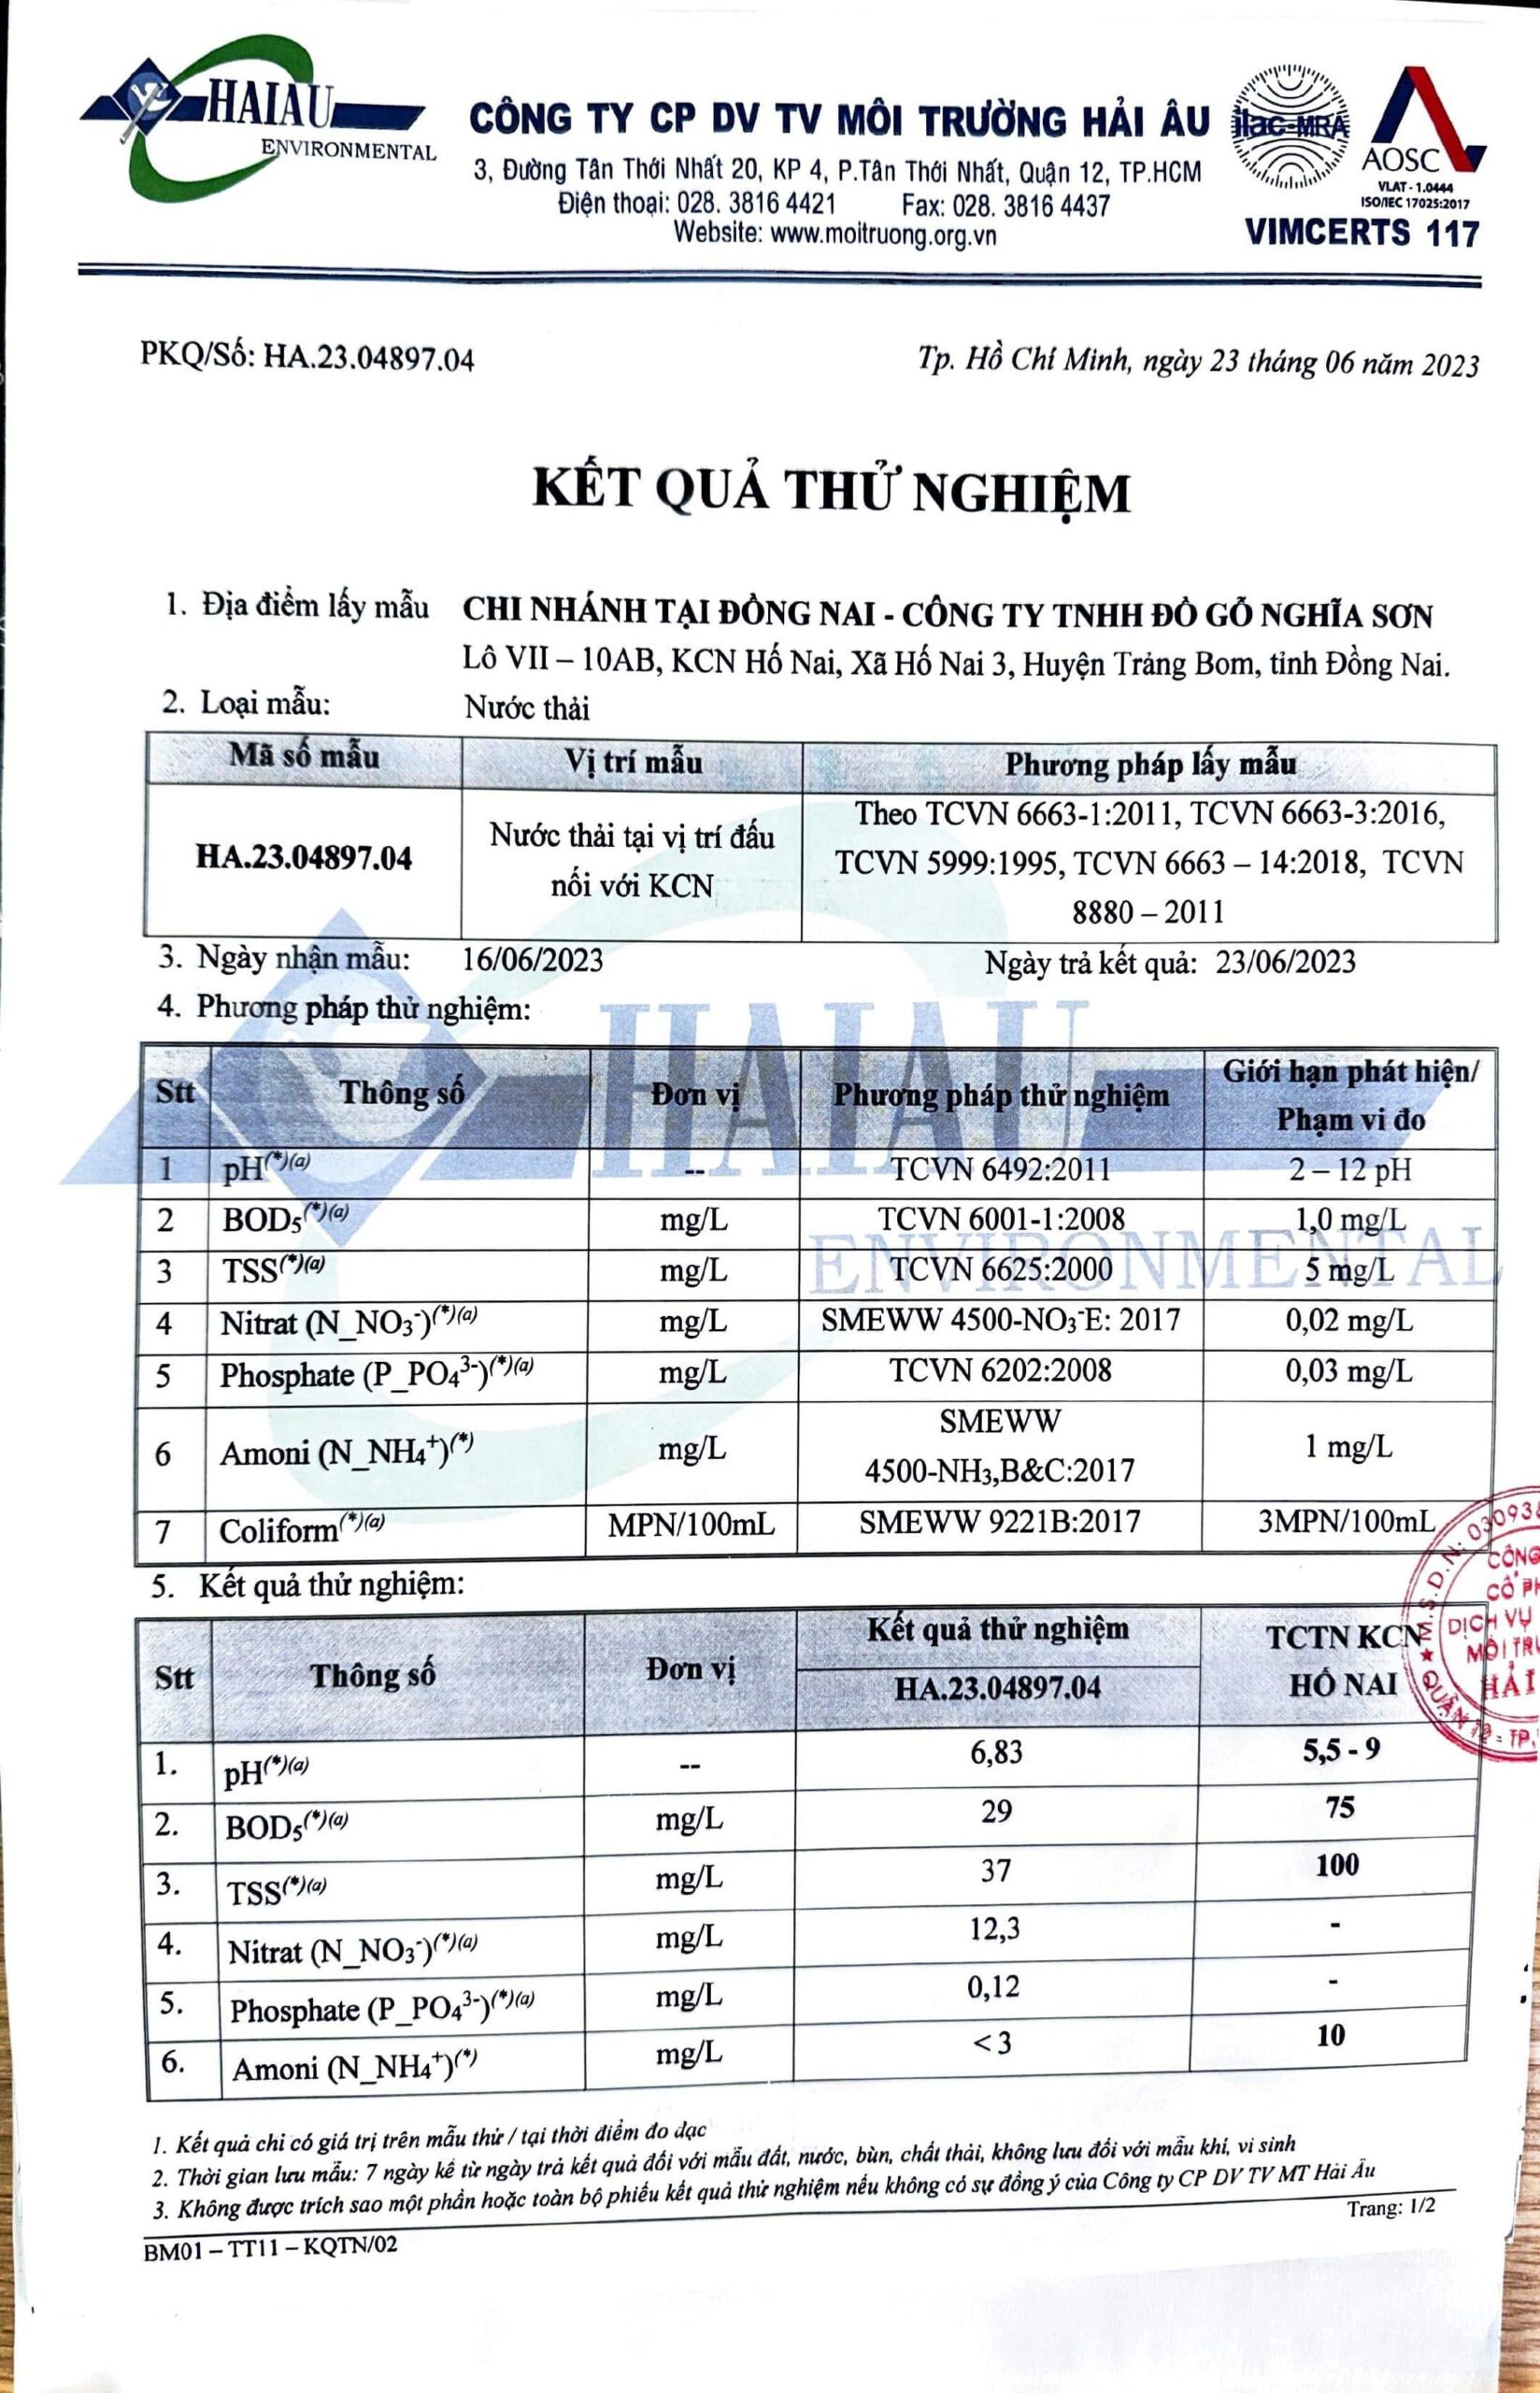
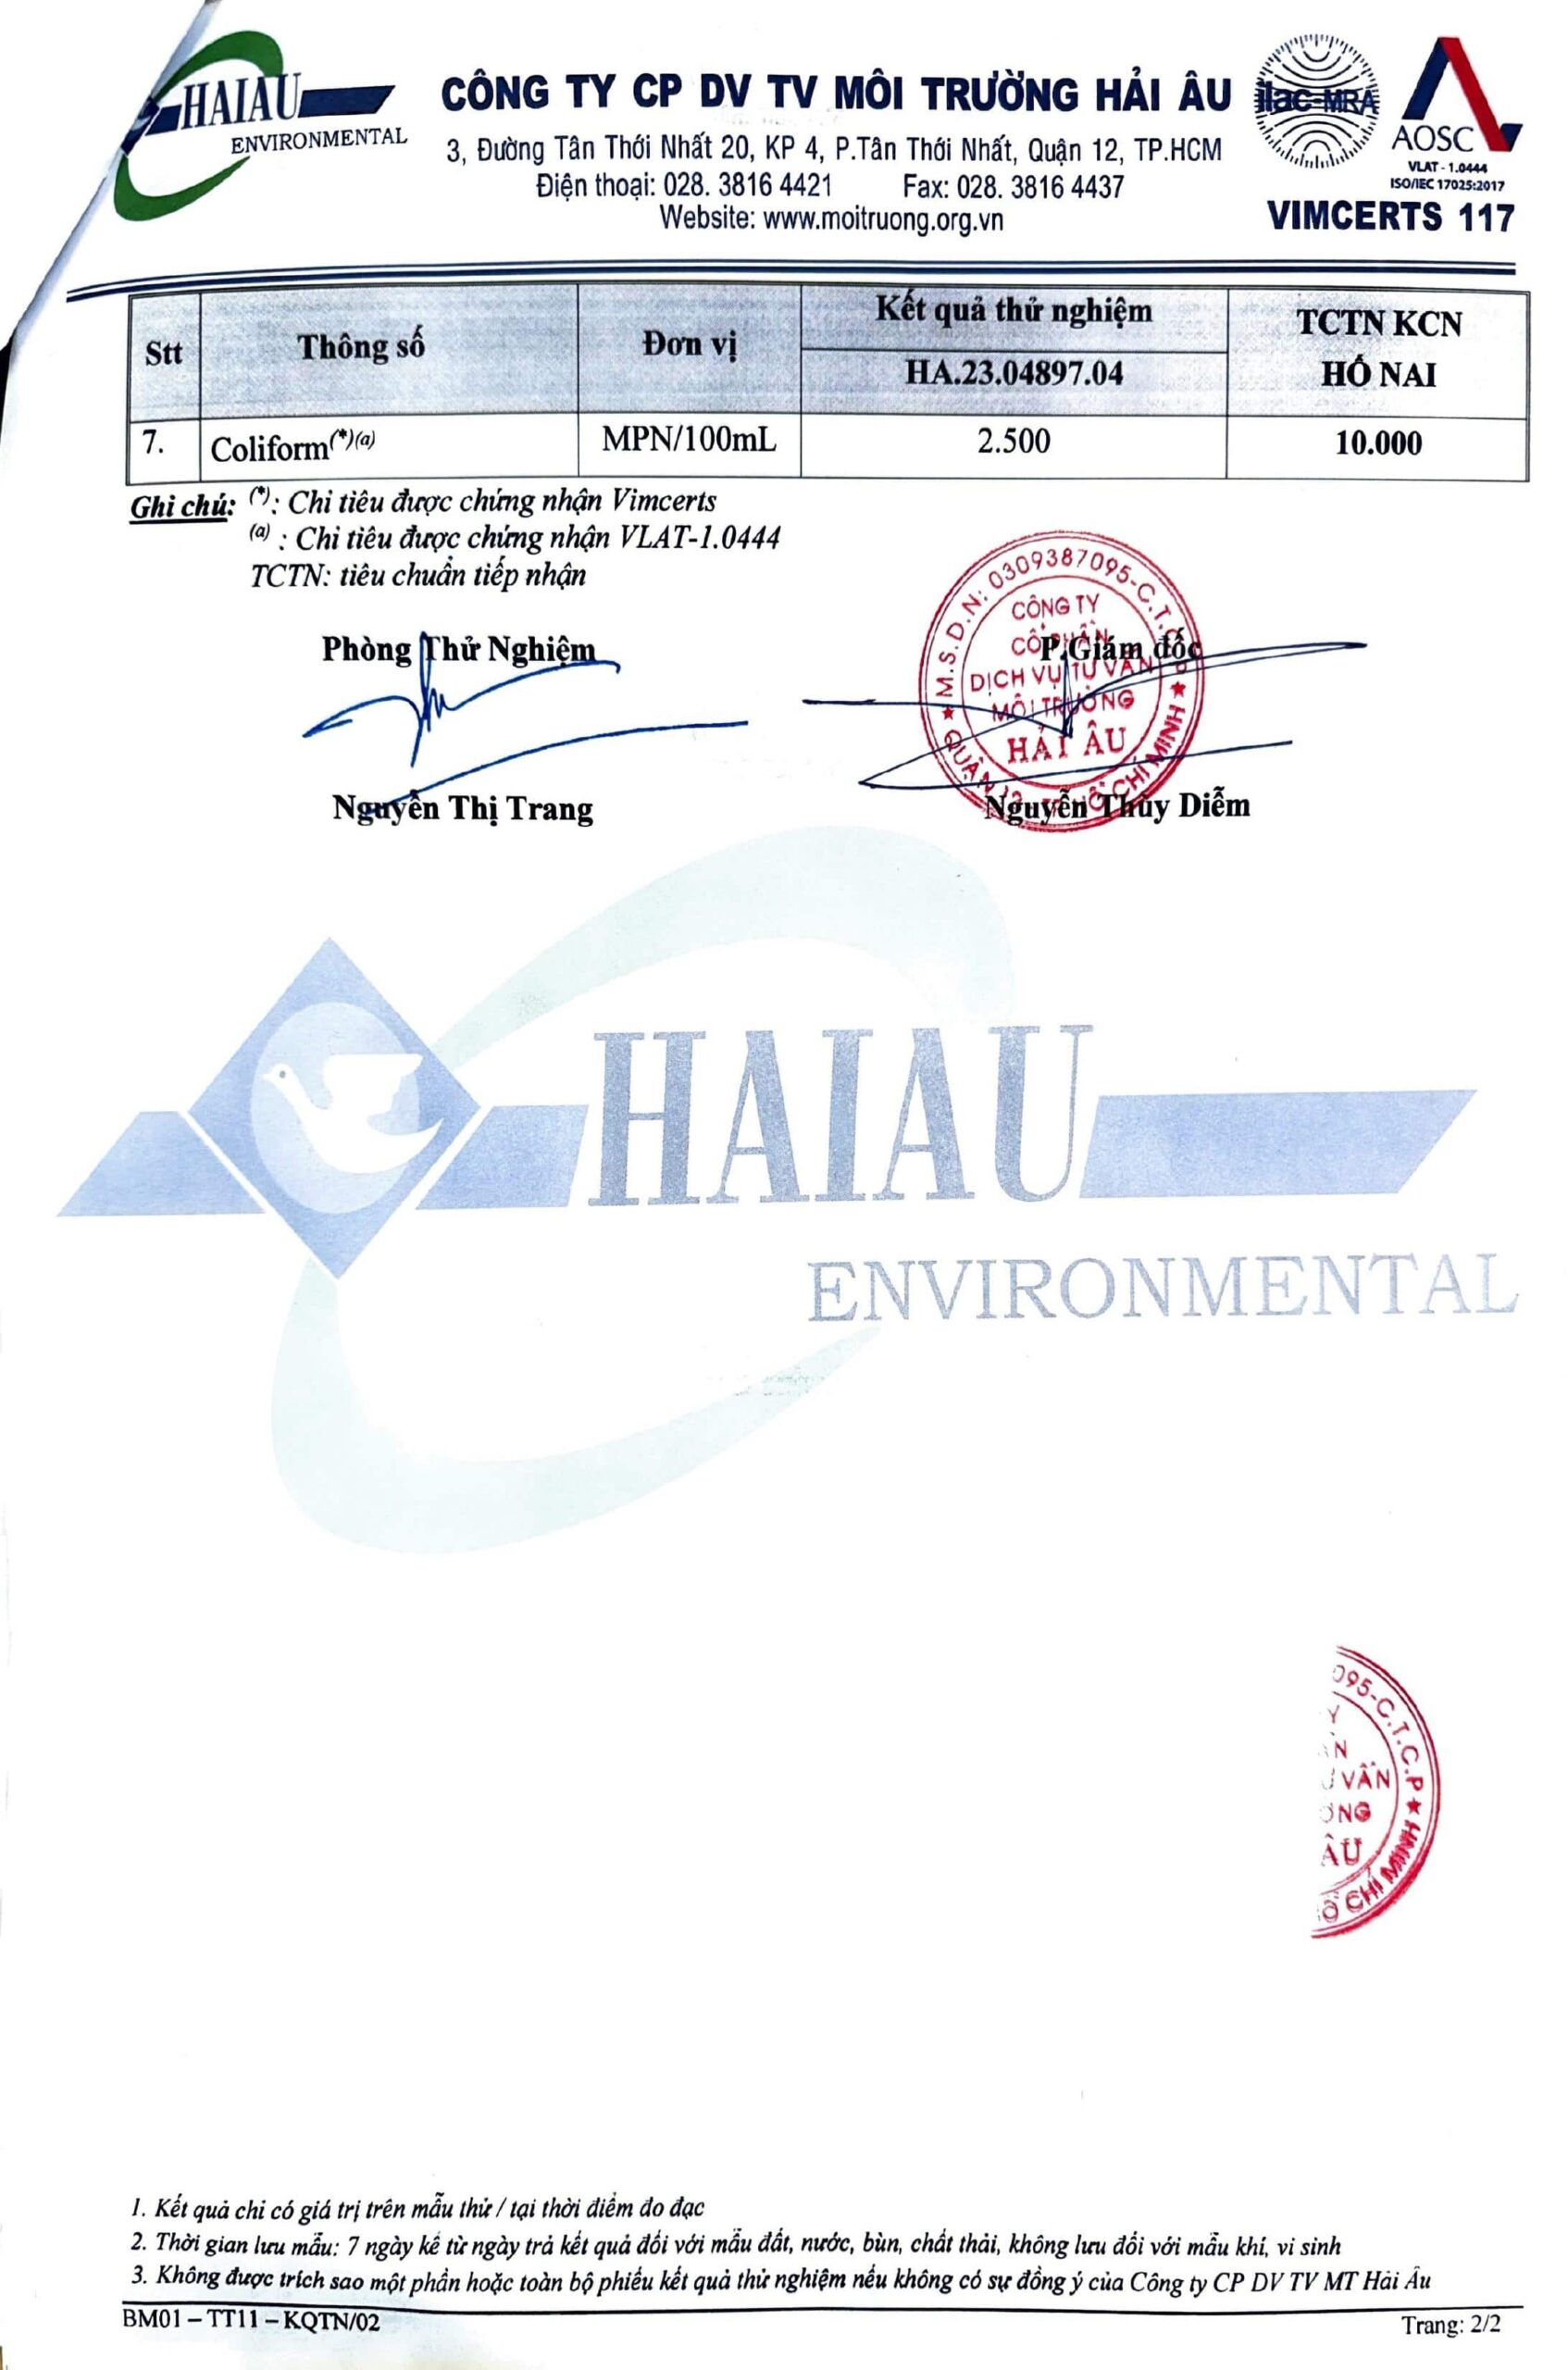
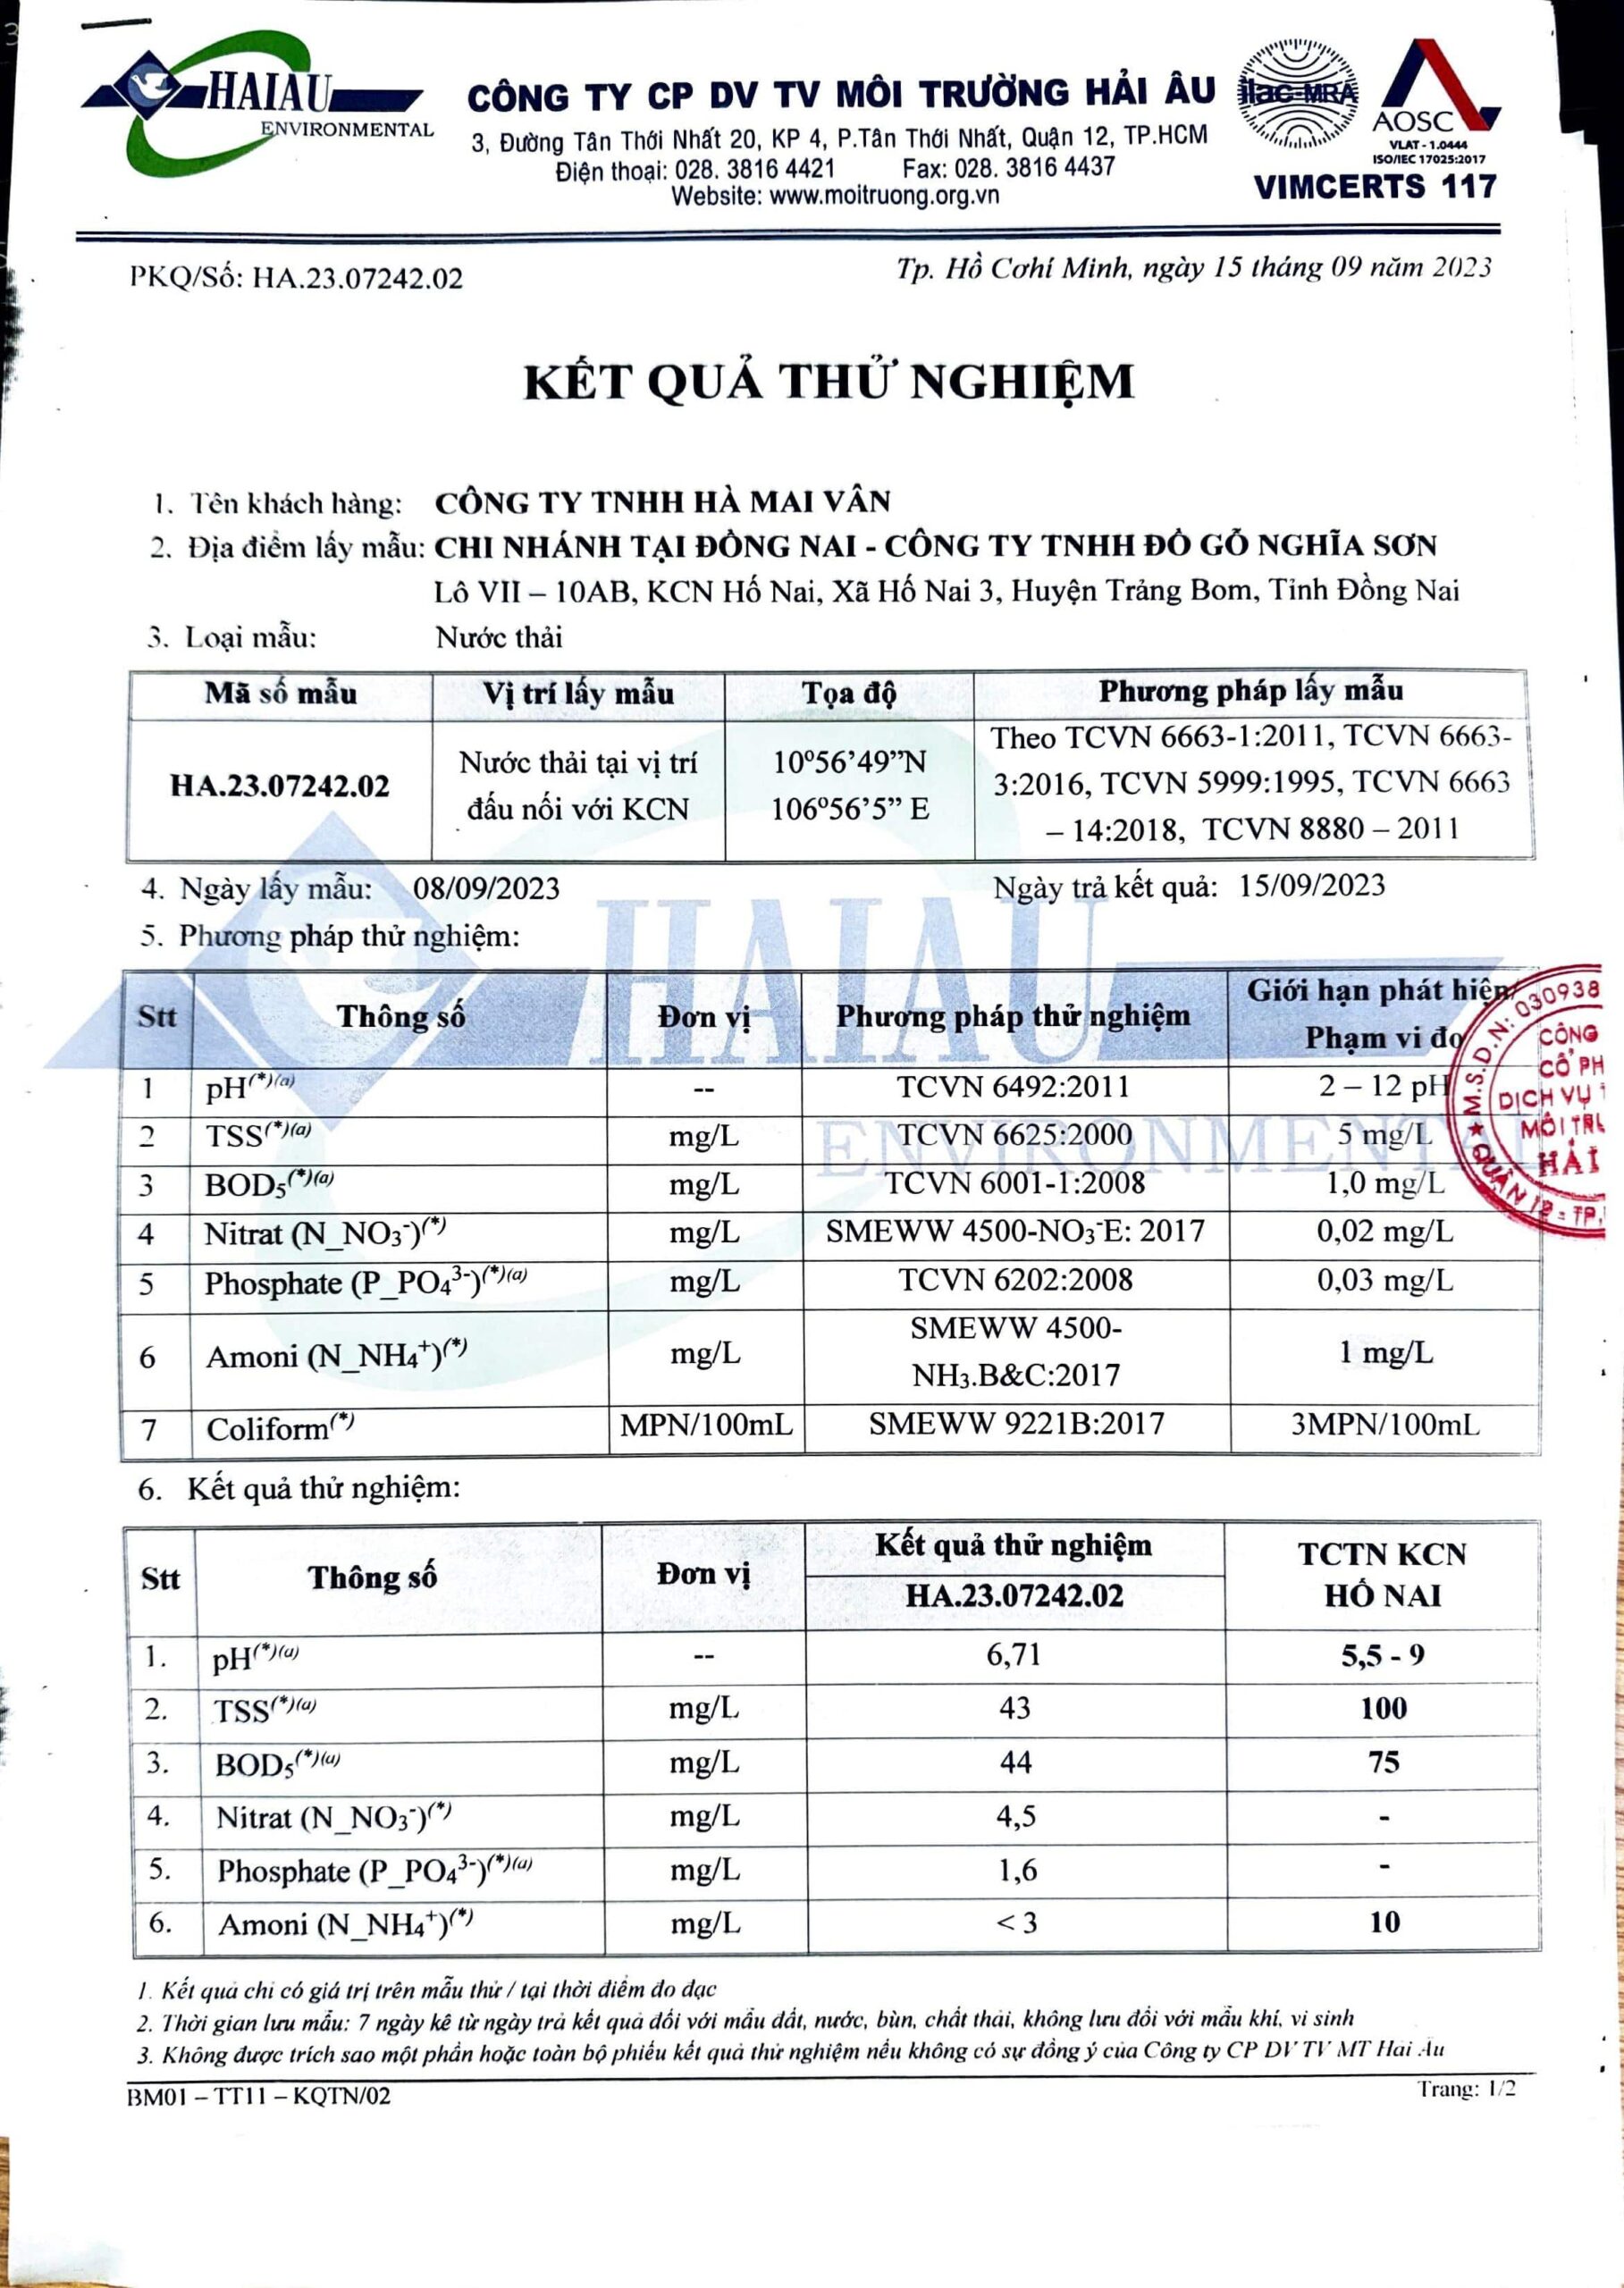
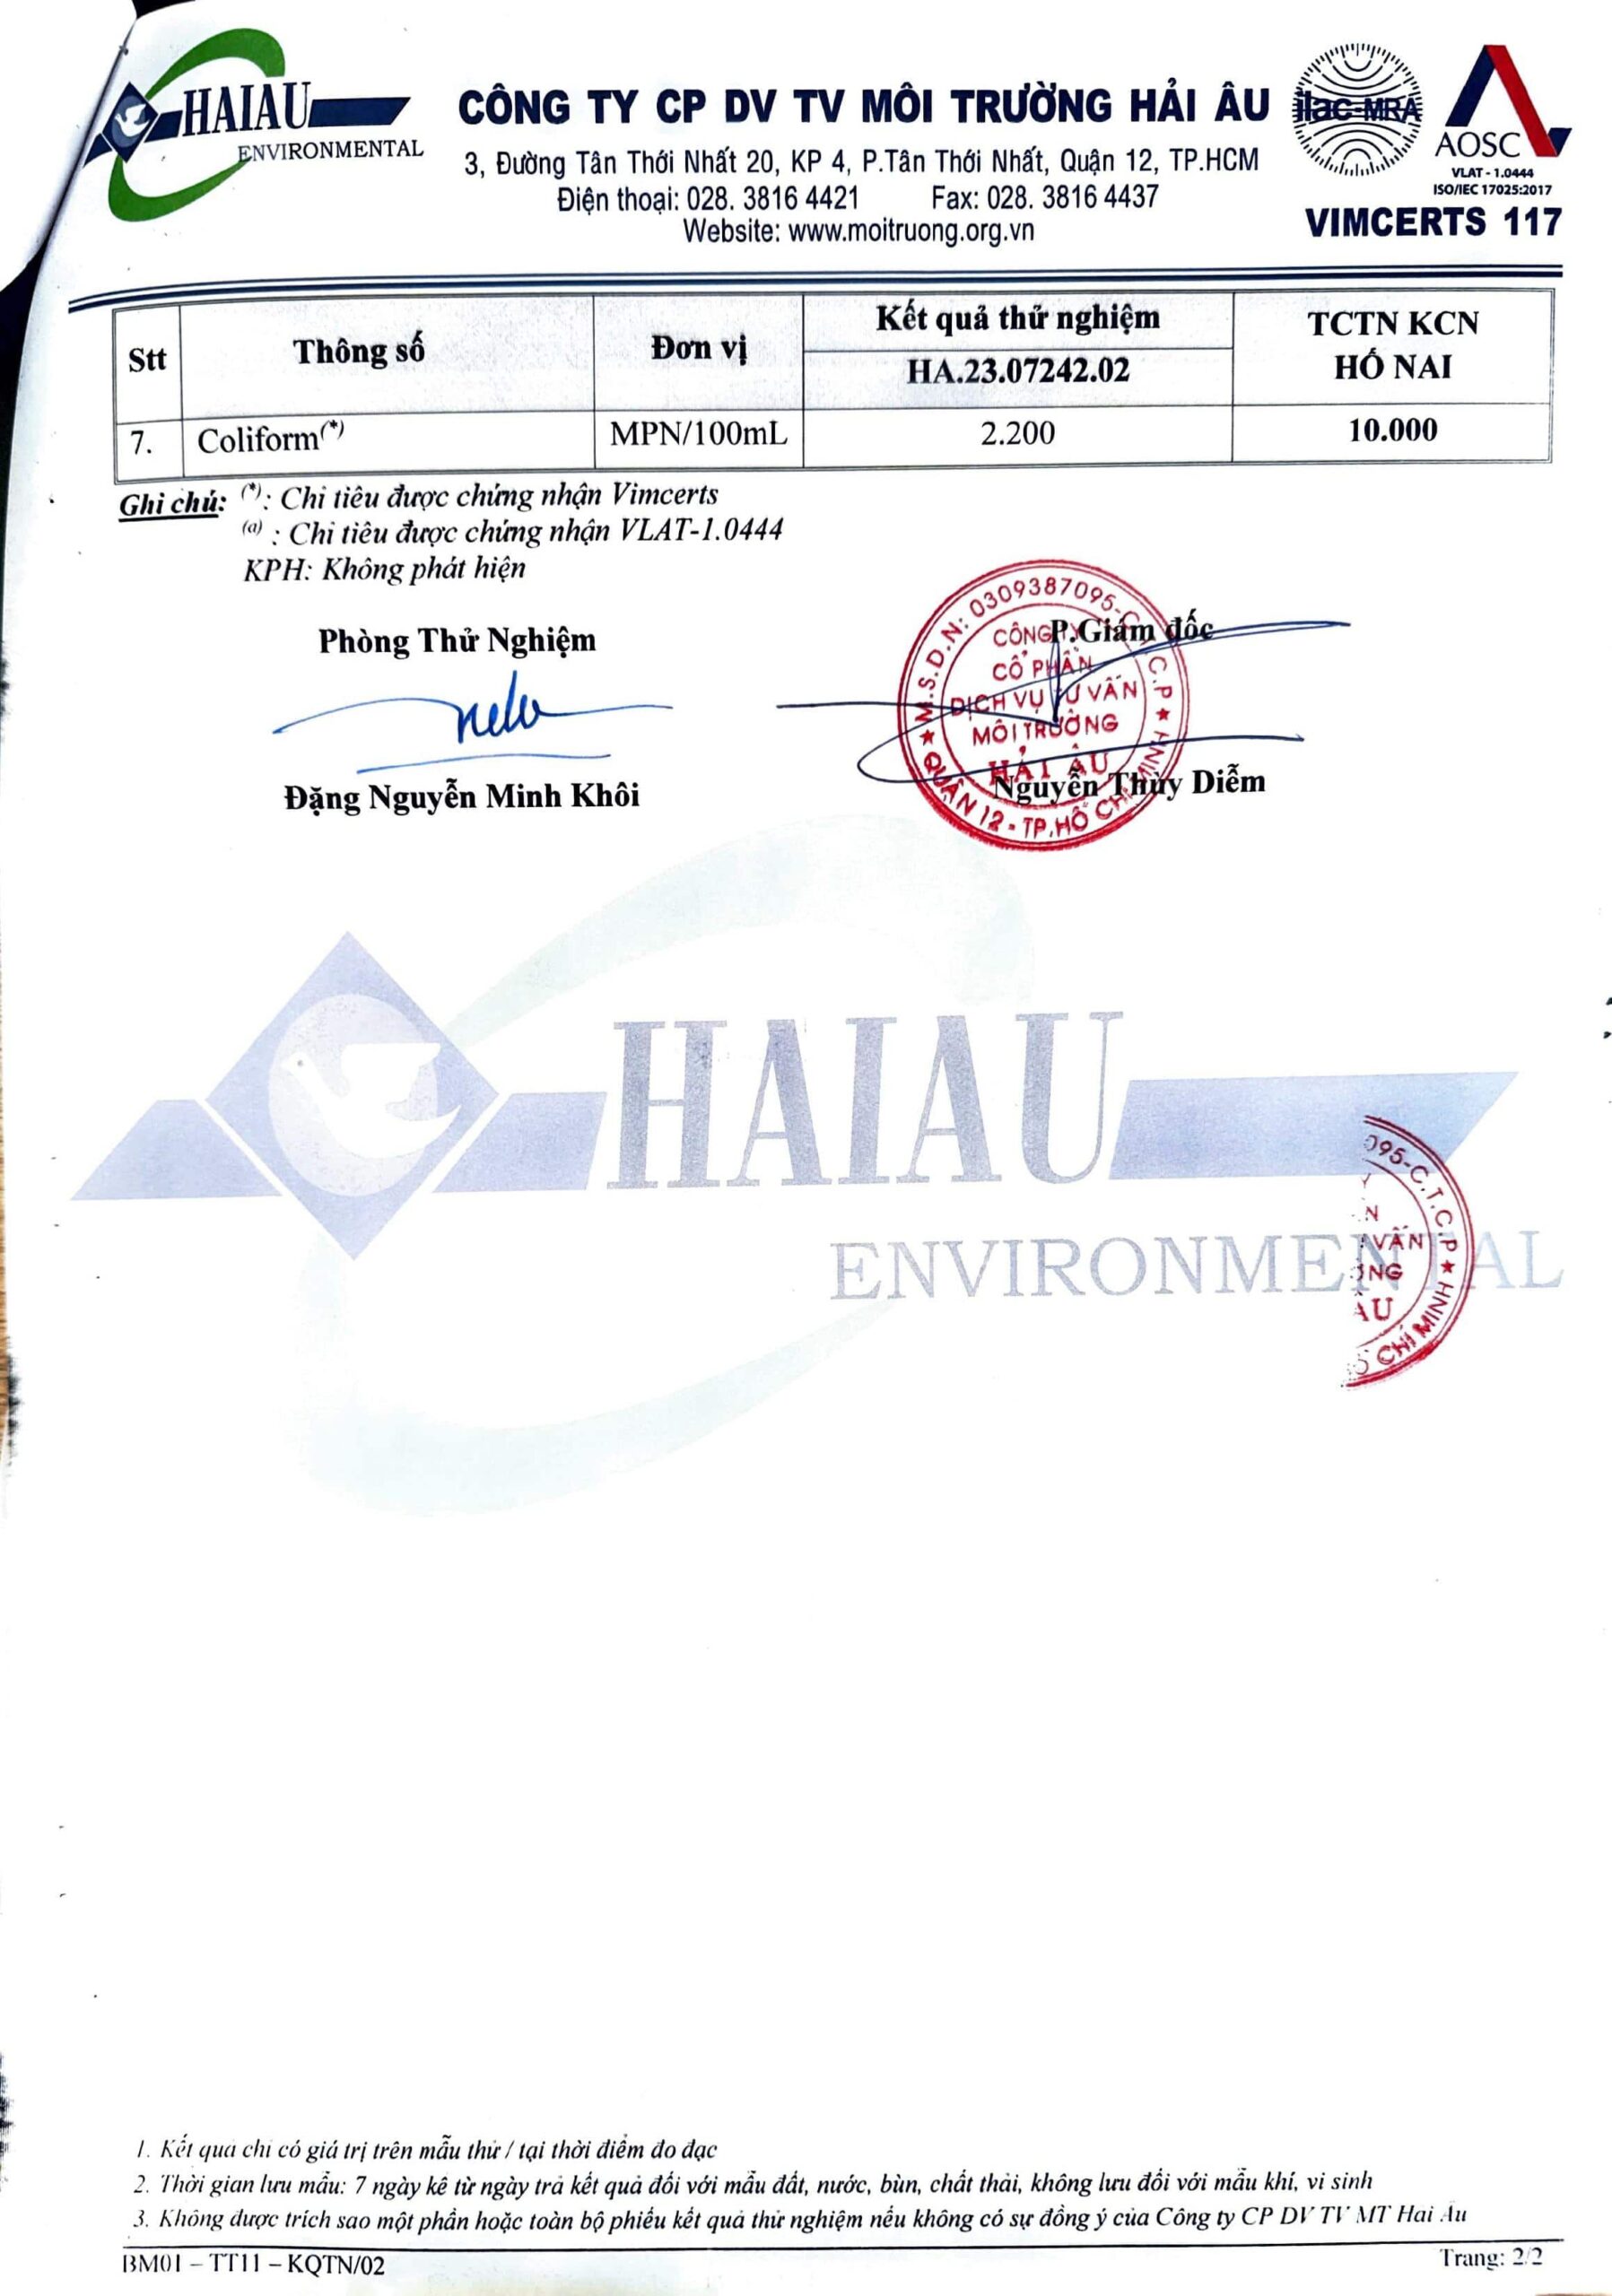
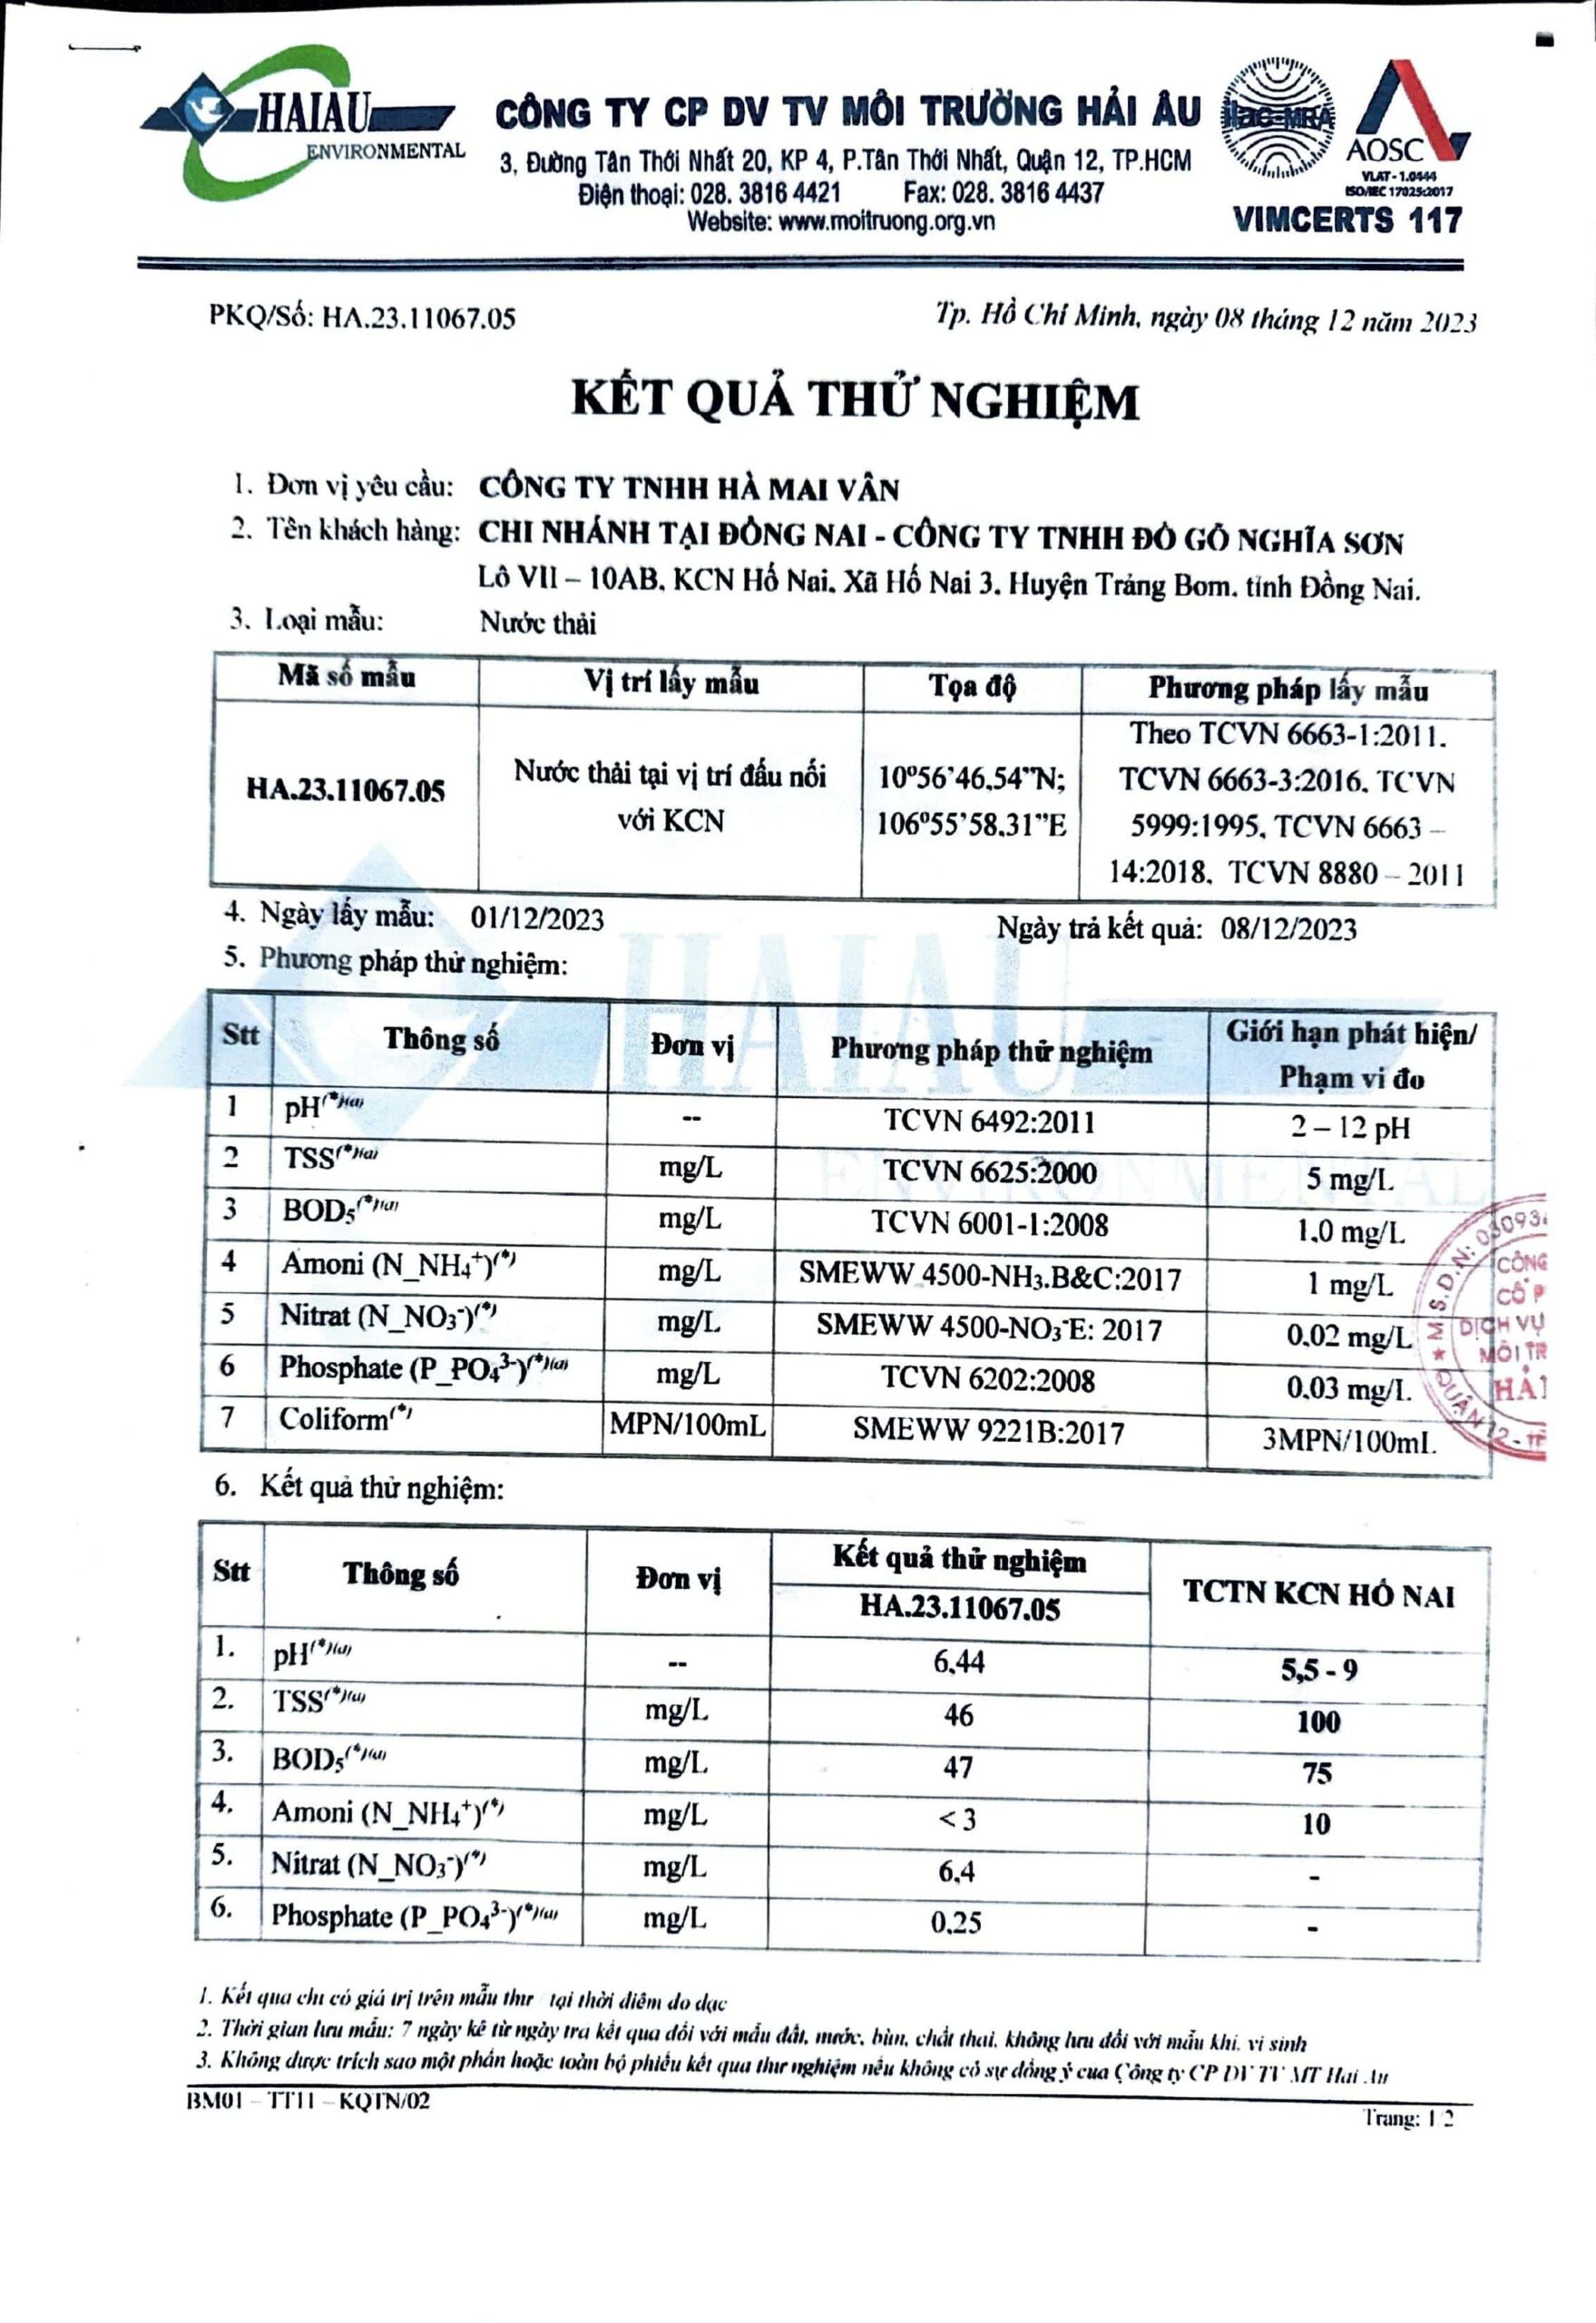
Factory 1 – Nghia Son Furniture Co., Ltd (Dong Nai Branch)
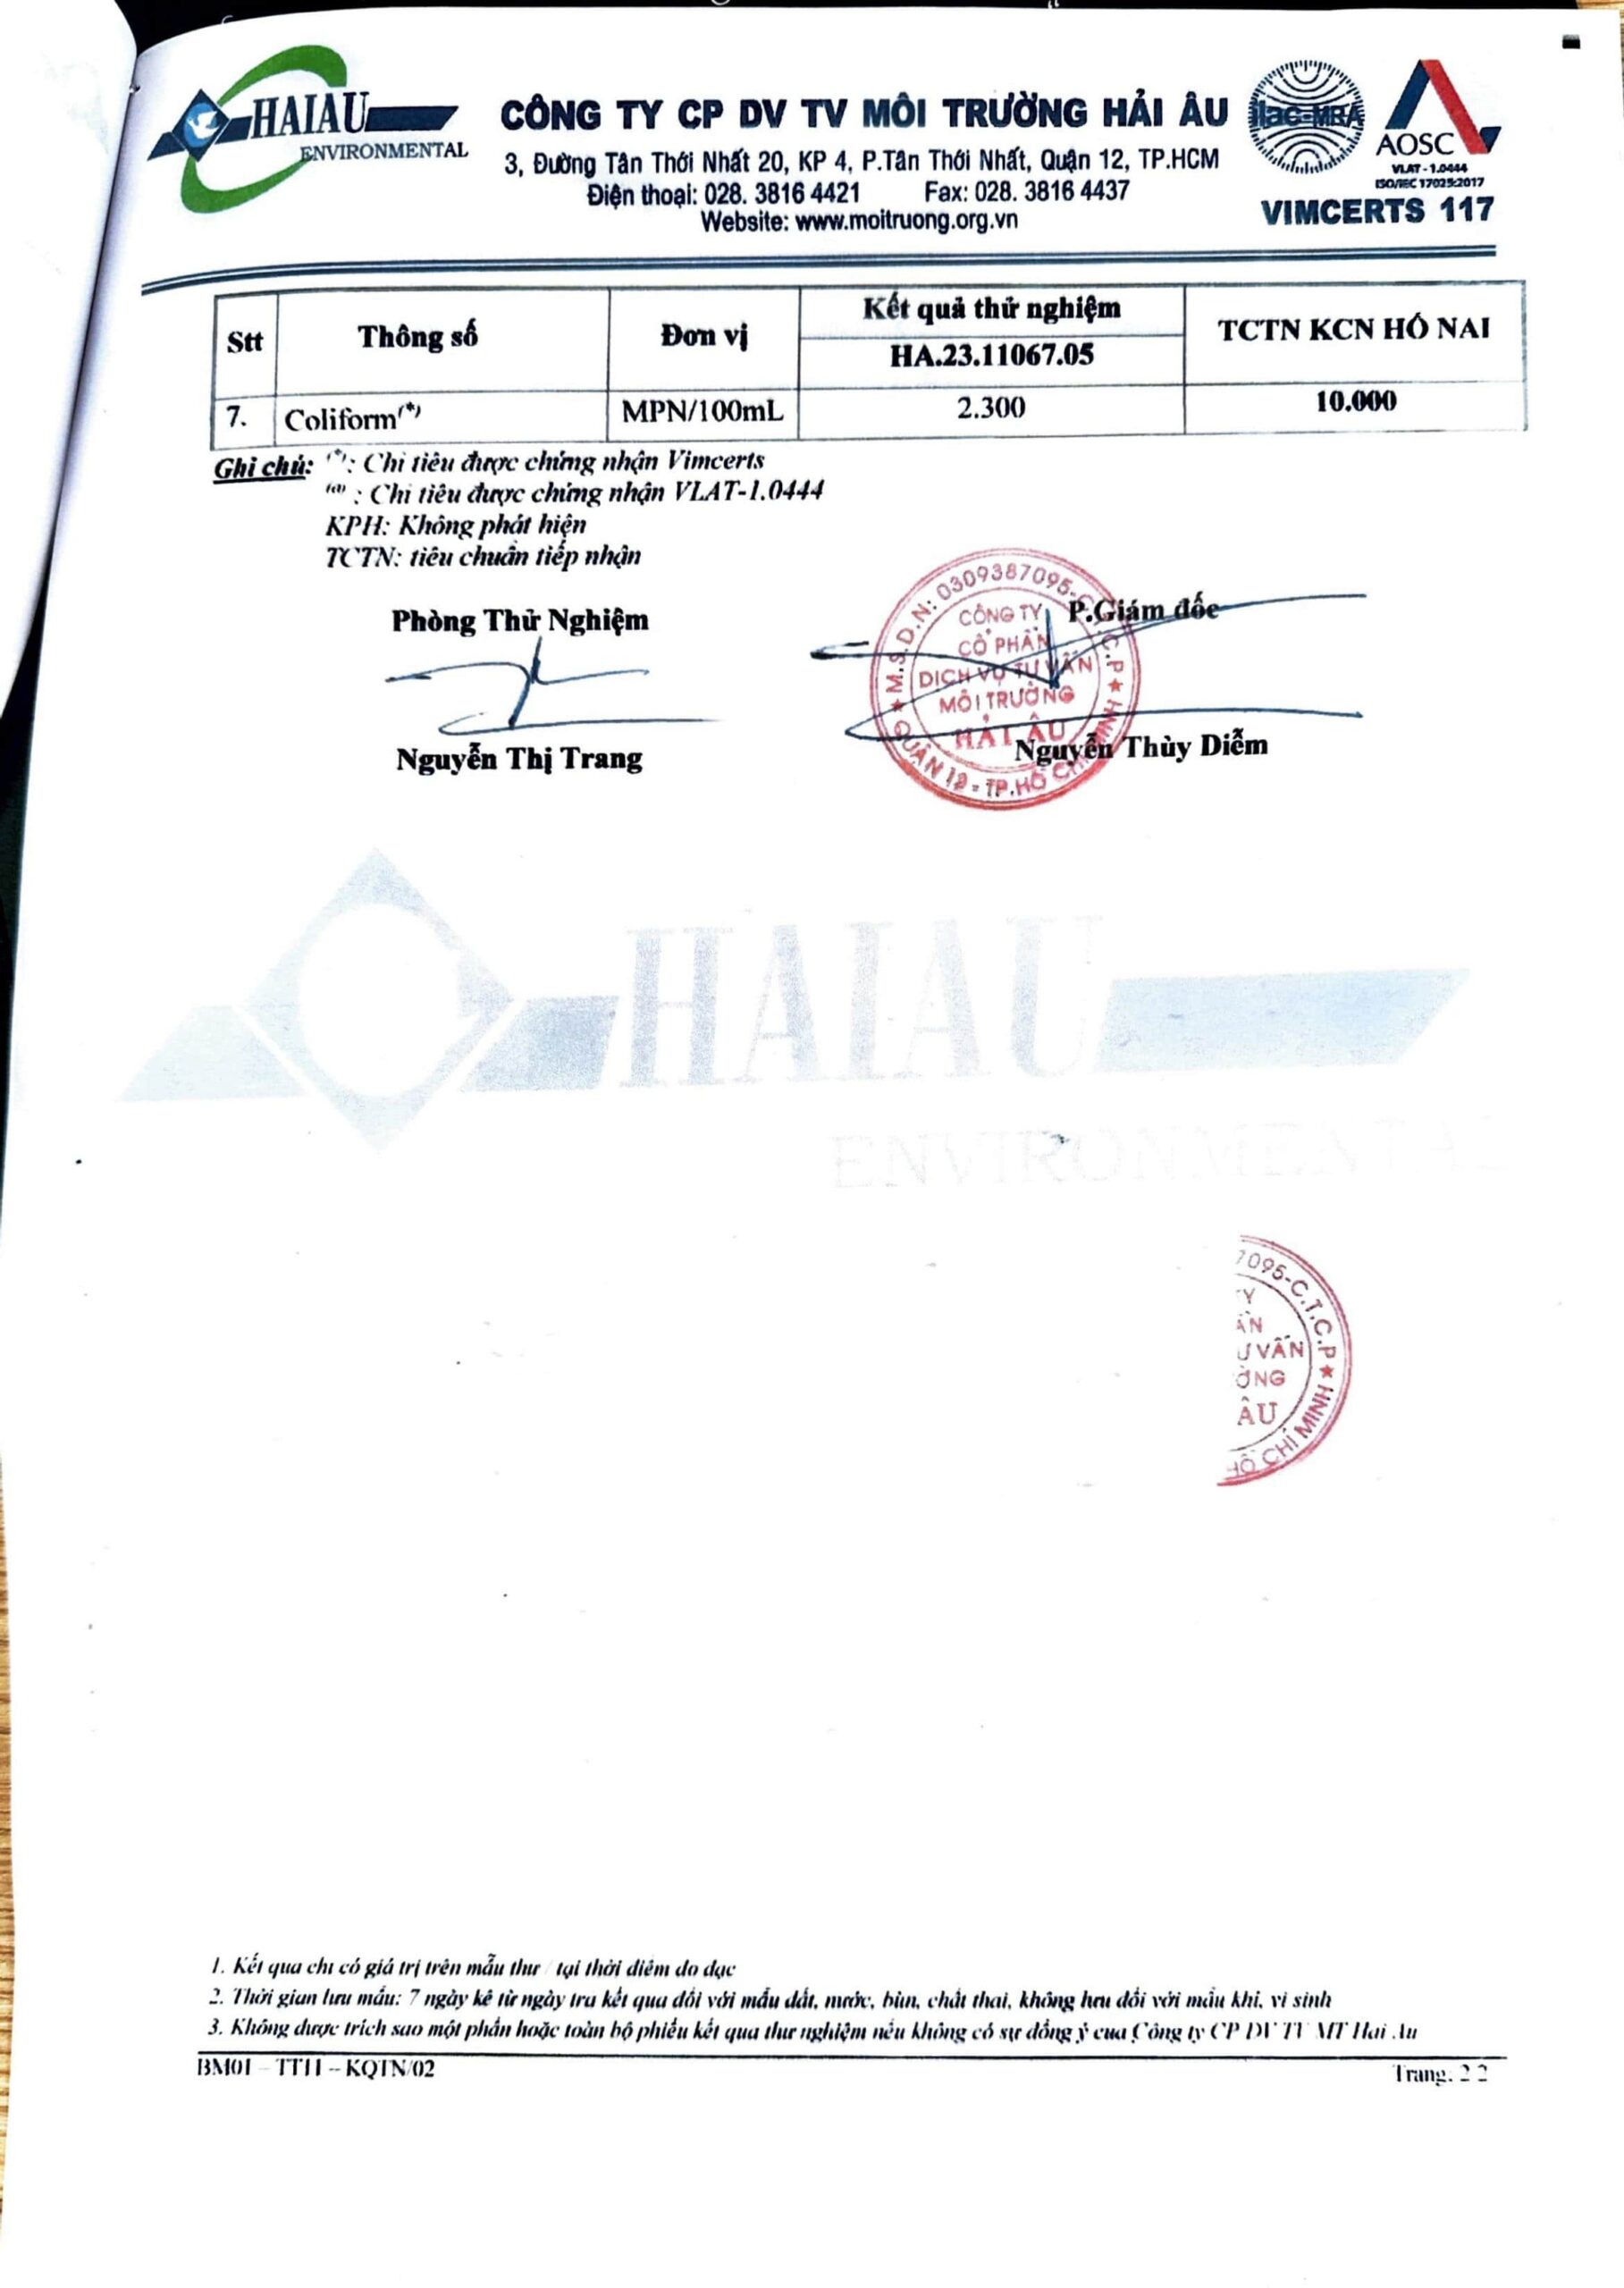
Factory 2 – Nghia Son Wood Products Mfg & Trading Co., Ltd

Frequently Asked Questions
It covers the 2023 and 2024 reporting years for CO2 emissions at both factories, and the 2023 wastewater measurement results for the Dong Nai facility. Earlier and later filings are published as they are completed.
Scope 1 covers emissions released directly on site, such as diesel oil, wood waste and rice husk burned in the boiler, and refrigerant loss from air conditioning. Scope 2 covers emissions generated elsewhere to produce the electricity purchased from the national grid.
The combined total rose 4.3 percent, from 3,832.39 to 3,997.25 tonnes, in line with higher production volume. Factory 1 actually fell 8.9 percent; the increase came from Factory 2, where grid electricity and boiler wood waste both rose.
Samples are collected on site and analysed by an accredited third-party laboratory. The signed certificates published above show the analysed parameters, the measured values and the permitted limits.
Yes. The tables and certificates on this page are the same records submitted to the authorities, and Nghia Son provides the signed originals on request to support supplier audits, EUDR traceability files and buyer sustainability questionnaires.